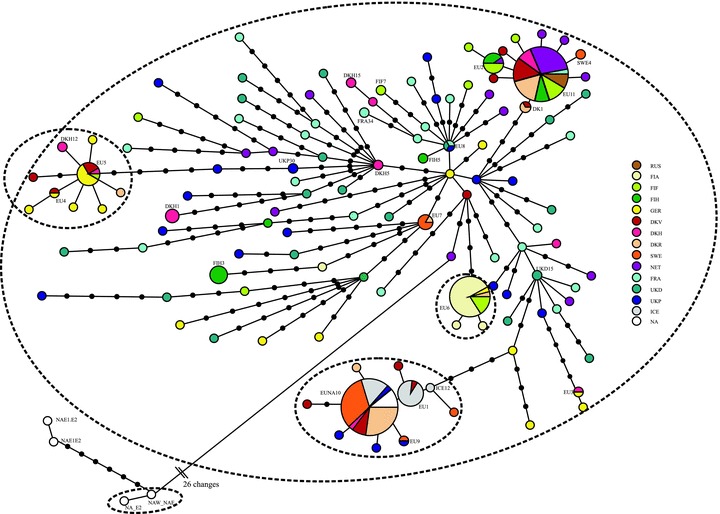
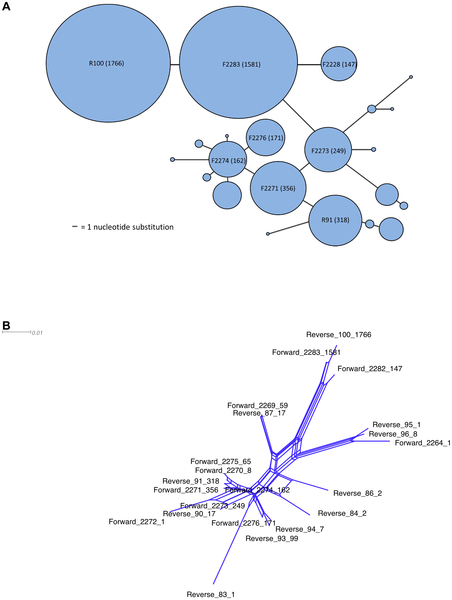
Some examples of graphs that scientists have created and published using Hapstar, all these images were taken from the papers that cite the hapstar publication, with links to them below. I think the range of representations of this genetic information indicate some exciting new directions we can take the software in. There are also some possibilities regarding the minimum spanning tree, finding ways to visualise and explore the range of possible MST’s for a given graph.
Hapstar graphs in the wild
by
Comments
One response to “Hapstar graphs in the wild”
-
How do you change the size of individual haplotypes in Hapstar (not all circles, just one circle in proportion to the number of individuals that share that haplotype). I could not manipulate the size of just one circle and was wondering how you did it in hapstar.
Thank you!
Kerin


Leave a Reply